“What usually takes us 4 days? We nailed it in 2 - shoutout to Claude AI.” Last December, during Centric’s Innovation Days, we looked at each other over our coffee mugs and thought: “Could we really turn a Figma design into production-ready code almost entirely with AI…without drowning in <div>s?”
Authors: Alexandru Popescu, Eduard Chirileac - UI/UX Designers

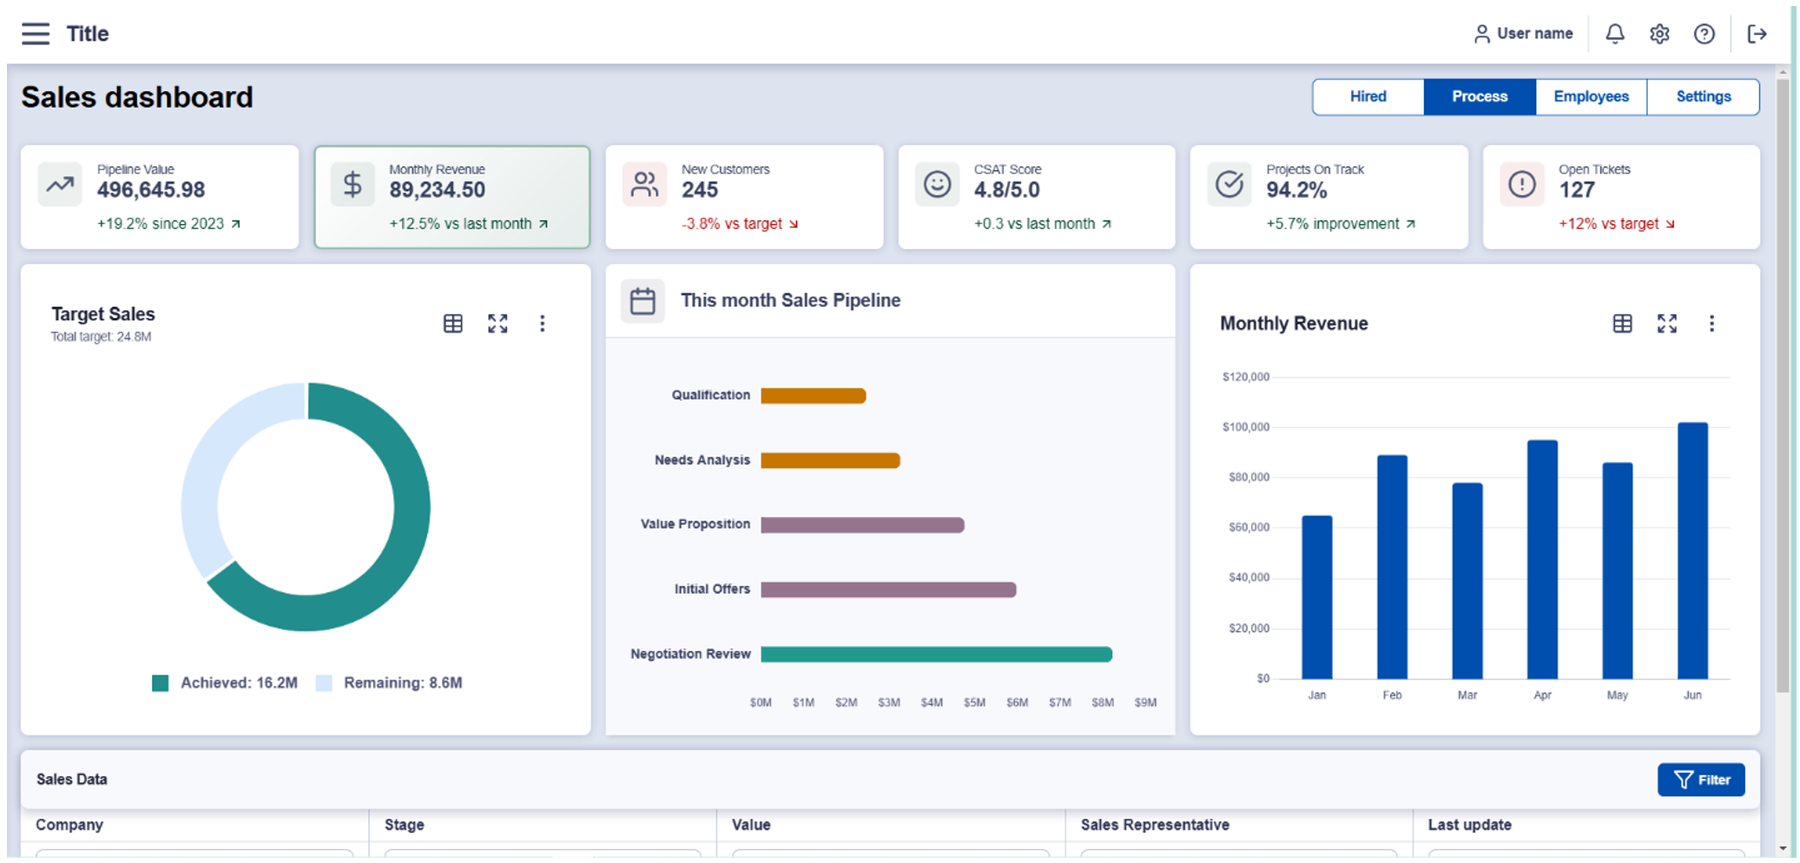
How we built a sales dashboard in 2 days with a little AI magic

Alexandru & Eduard - UI/UX Designers
Spoiler alert: We did.😉 Here’s our roller-coaster ride, complete with high-fives, face-palms, and a dash of humor.
Before we begin, we want to clarify that no sensitive Centric data was shared with Claude AI during this trial. The work was conducted using a fictional dashboard that simply followed the look and feel of our UI Design Kit. Since UI Kits are fairly standard in themselves, there is no reason for concern regarding security. It’s essential to act responsibly when working with AI tools, and to ensure that no sensitive or confidential data is shared by accident.
The “Why Are We Doing This?”
We both love beautiful UIs - but hate the repetitive grind of slicing designs, writing boilerplate, and then untangling the spaghetti that most code-gen tools spit out. Our mission:
- Speed. Slash our four-day build time in half.
- Quality. Keep semantic HTML, responsive breakpoints, and accessibility.
- Real-world demo. A live sales dashboard, not just pretty snippets.
Phase 2: Our Three-Step Workflow
Before touching VS Code, we spent half a day:
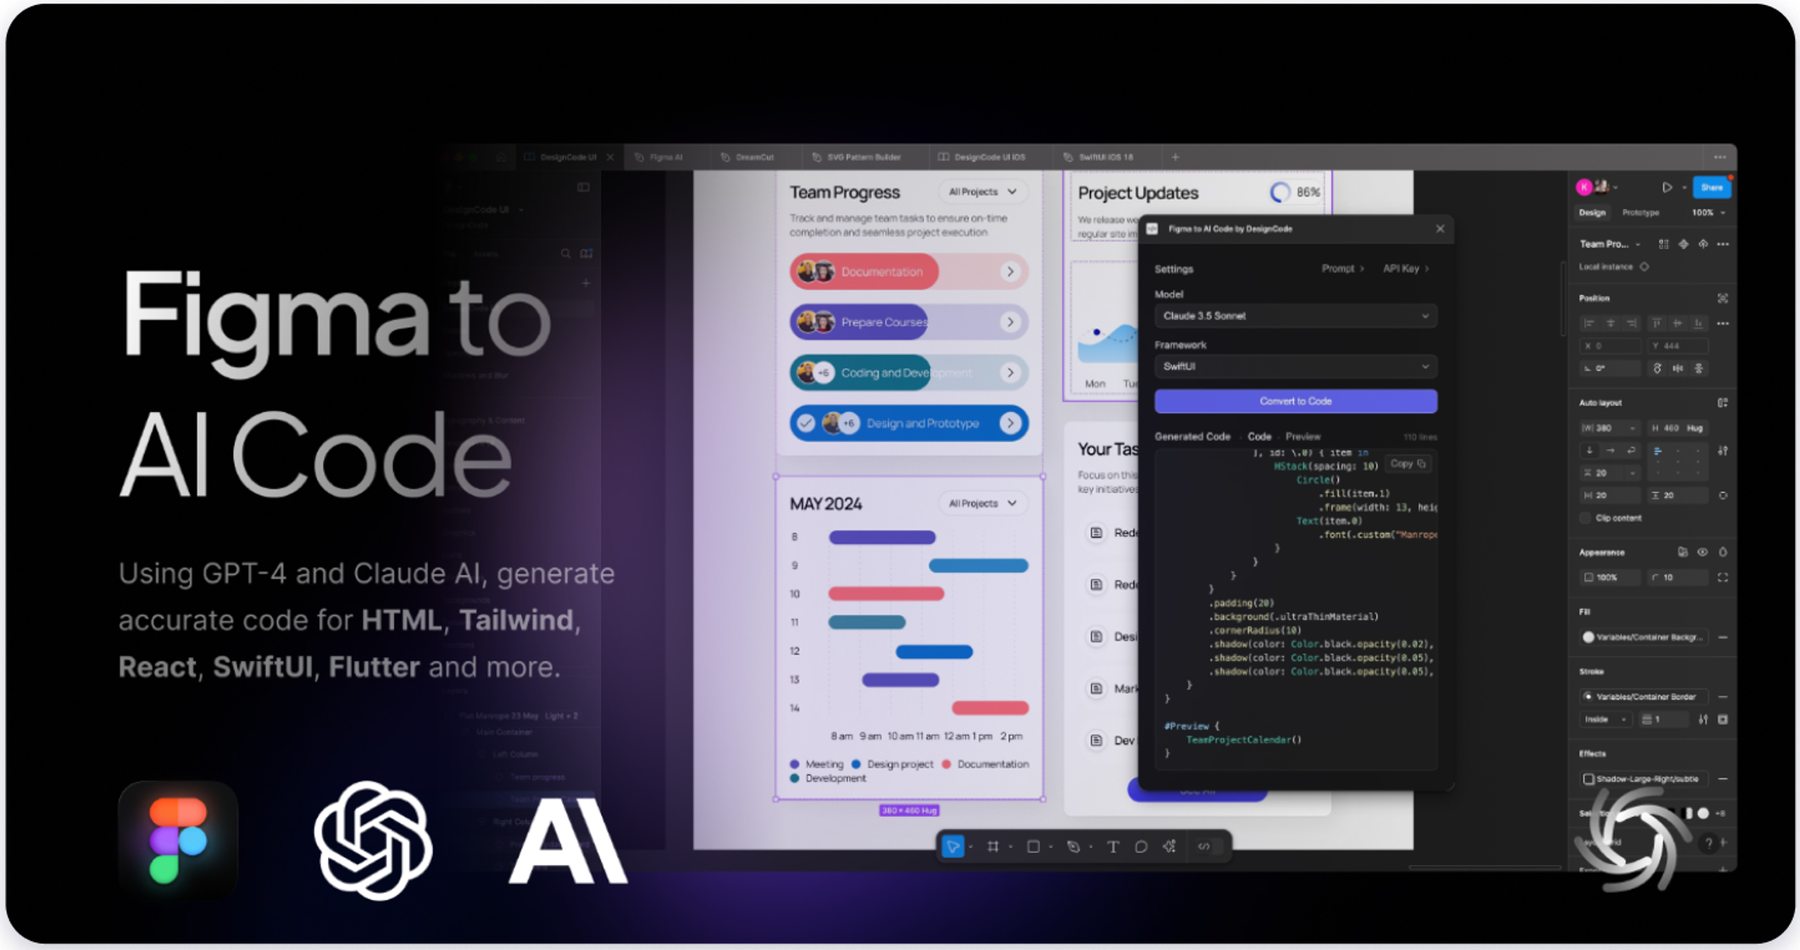
- Testing AI plugins. We ran the “Figma to AI Code by DesignCode” plugin (and a couple of others), compared outputs, and – honestly - laughed at some of the wild nesting it produced. 😂
- Whiteboarding the dashboard. We sketched out our charts, side-nav, and interactive filters so the AI wouldn’t wander off into random-land.
Key takeaway: The plugin mirrors every Figma layer 1:1. That’s great for fidelity…terrible for clean markup.
Phase 2: Our Three-Step Workflow
- Auto-generate the skeleton
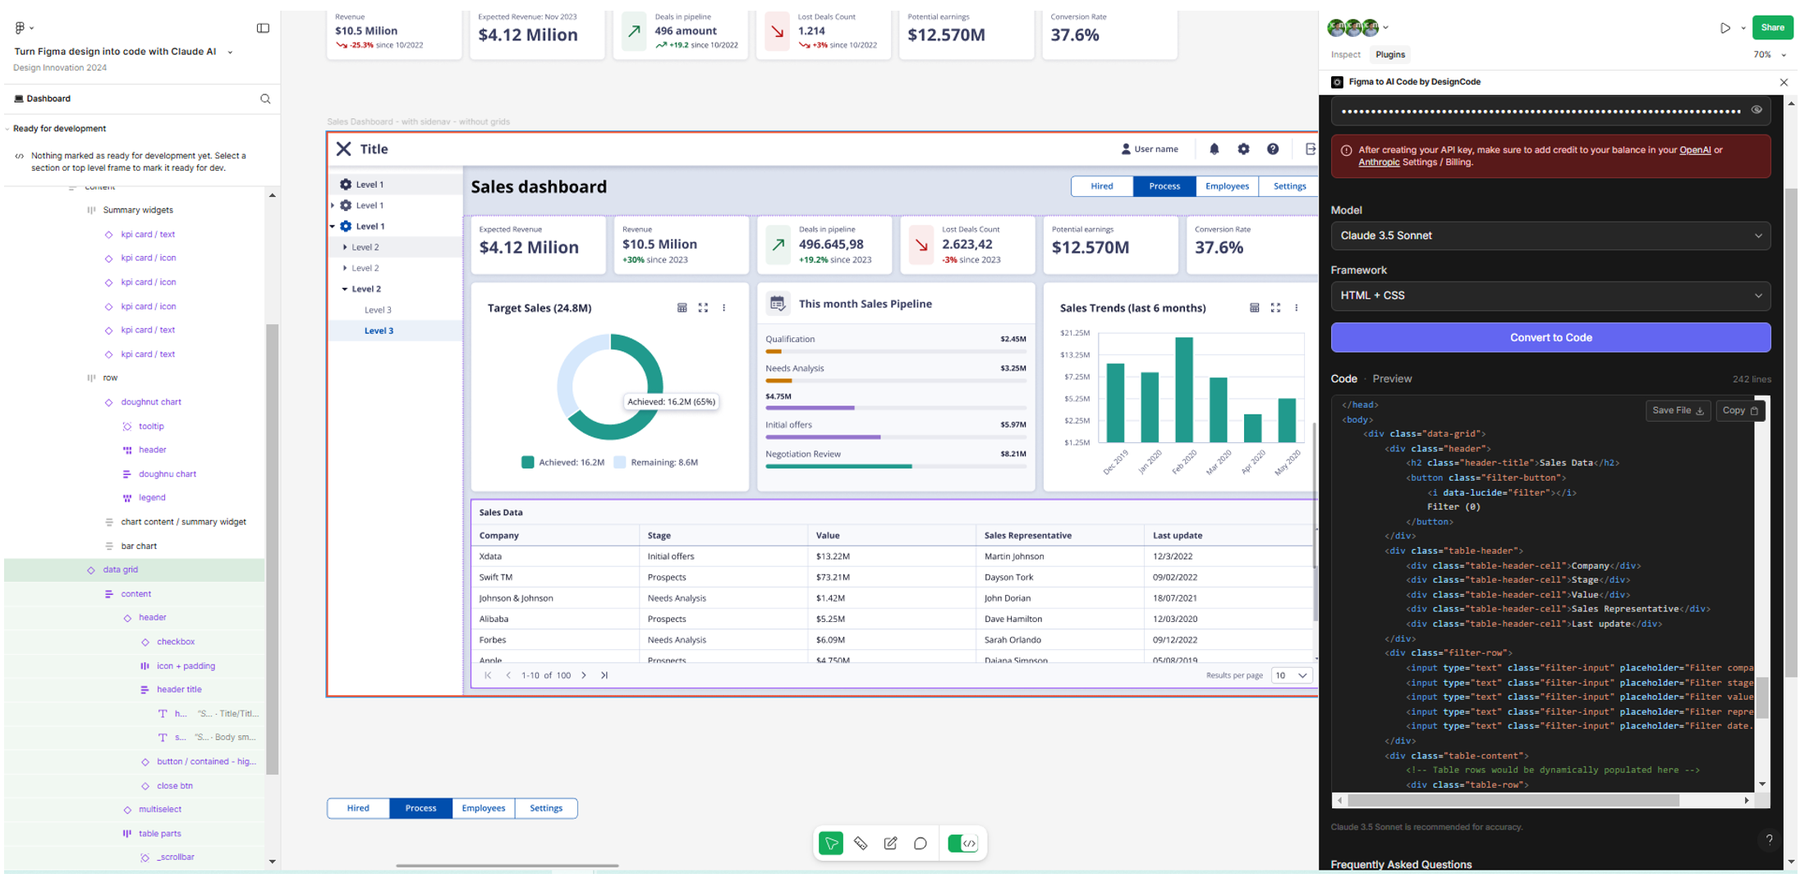
- Ran the DesignCode plugin with Claude Sonnet API.
- Outcome: A pixel-perfect HTML/CSS skeleton—plus about 50 extra <div>s. 😅
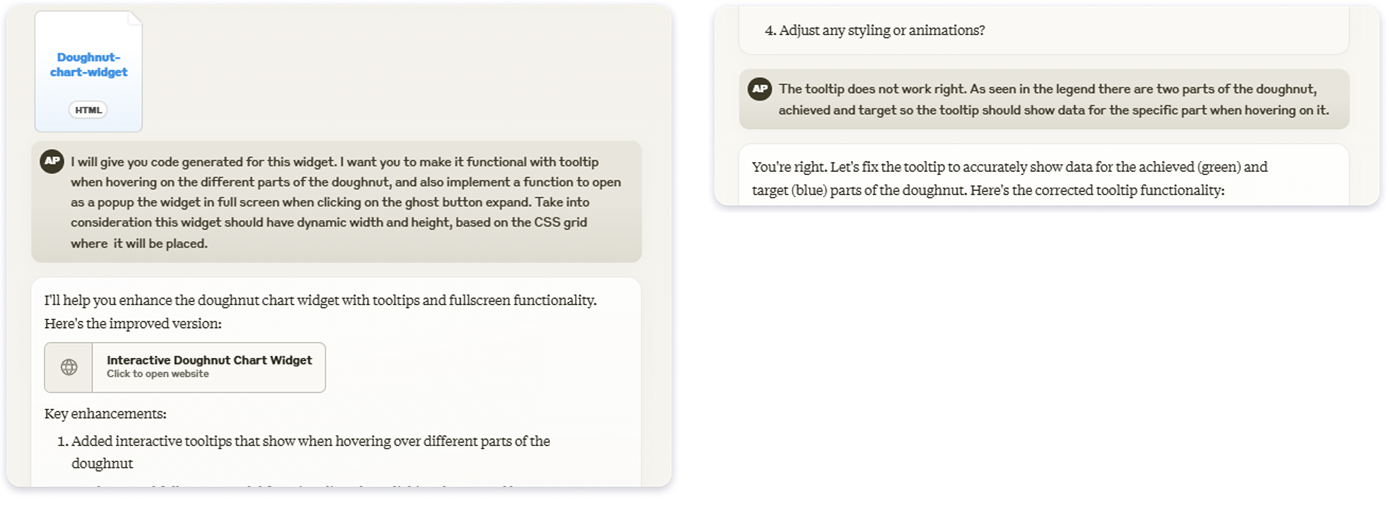
2. Prompt-powered cleanup
- Asked Claude: “Swap these nested <div>s for <sidenav> and <section> where it makes sense.”
- Requested responsive breakpoints and simple JS for chart tooltips.
- Outcome: Neat, annotated components that actually read like code we’d write ourselves.
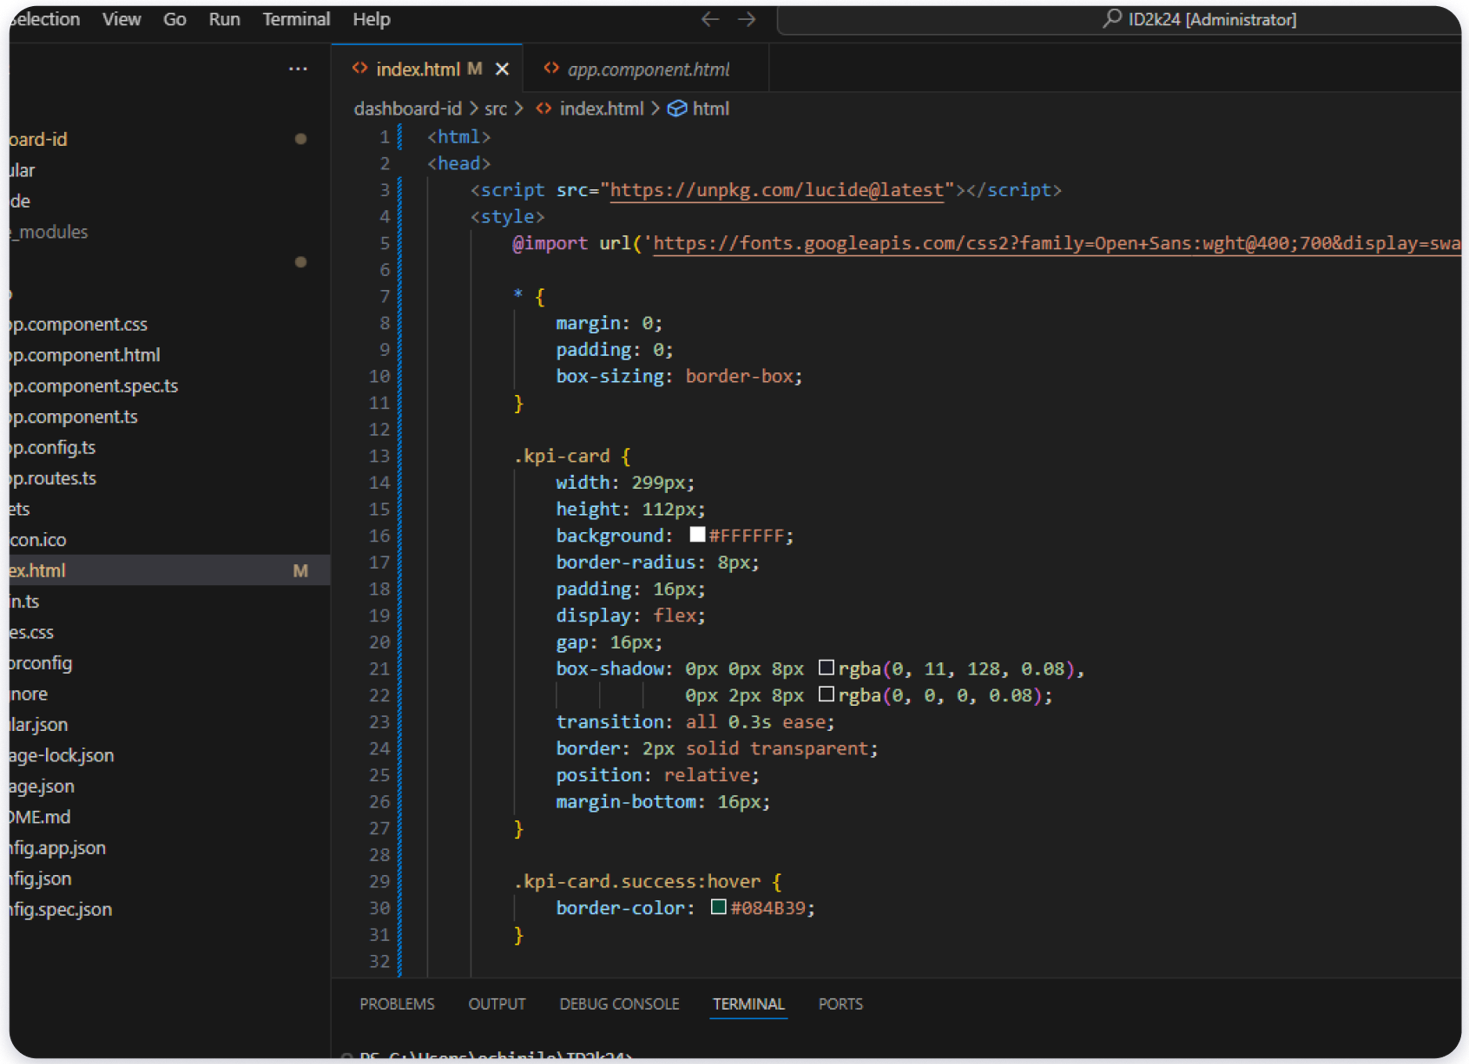
3. Dev-team polish
- In VS Code, we hooked up real data endpoints, ran lint & formatter, and yanked out any leftover clutter.
- Tested on mobile and desktop, tweaked ARIA labels—then kicked back with a celebratory .
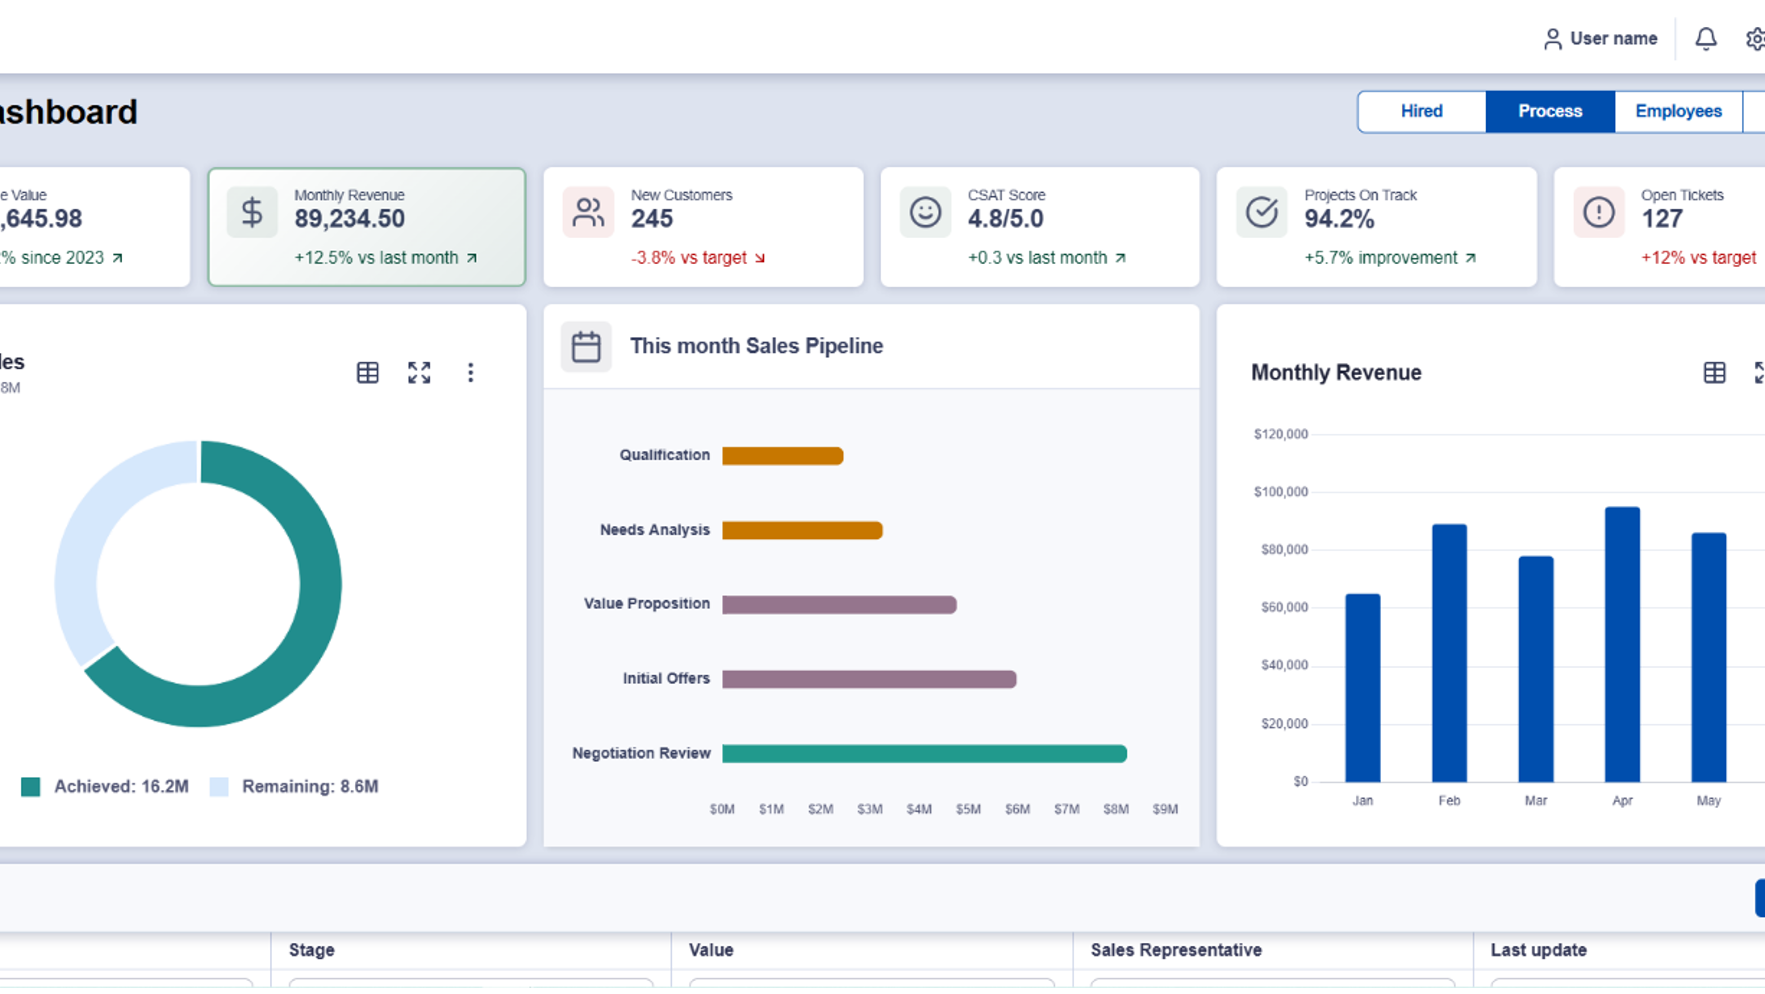
Final result: Functional Sales Dashboard
The “Oops” Moments
- Nesting overload. We forgot to flatten one Figma group and ended up with a <div> inception. Next time: fewer layers up front.
- Variant confusion. Feeding an instance instead of the master component lost some style variants. Rookie move - we fixed it by always pointing at the source.
- Token shock. We burned through Claude AI tokens faster than expected. Pro tip: budget for API costs before you go wild. 💸
The Payoff
- Time saved: 2 days vs. 4 days.
- Markup quality: >90% semantic HTML, fully responsive.
- Dashboard result: Live sales charts, filters, nav – production-ready, maybe?! ✅
And here’s what really excited us:
- The prototype felt way closer to the final product than a typical Figma mockup. We could easily show it to a client for early feedback before even reaching development.
- It opened the door to better collaboration with the development team. We genuinely believe we can get to higher-quality code, faster, when designers deliver clean, structured HTML/CSS that a dev can just plug into Angular/React/whatever.
- It gave us more control as designers over the little front-end details—like how components behave at different breakpoints, hover effects, and even subtle micro-animations. The result? Interfaces that feel “alive” and genuinely delight users.
What’s Next for Us
- AI agents on autopilot. Imagine a bot that watches Figma, runs the plugin, cleans code, and even deploys it. We want that.
- Team workshops. Train our designers on AI-friendly file prep and prompt craft.
- High Fidelity Prototyping with FE, like in the good old days of design, instead of prototyping with a design tool? Instead of middle fidelity prototyping, achieved with Figma/prototyping tools.
- Framework wrap-up. Next experiment: end-to-end React and Angular component generation.
“We’re just getting started. AI handled the boilerplate - now we get to focus on the fun parts of design.”

